rocprof
rocprofv2 allows profiling both HSA & HIP API calls (rocprof being deprecated).
Let's profile simple copying kernel saved in profile.jl file:
using AMDGPU

function mycopy!(dst, src)
    i = workitemIdx().x + (workgroupIdx().x - 1) * workgroupDim().x
    if i ≤ length(dst)
        @inbounds dst[i] = src[i]
    end
    return
end

function main(N)
    src = ROCArray{Float64}(undef, N)
    dst = ROCArray{Float64}(undef, N)
    groupsize = 256               # nthreads
    gridsize = cld(N, groupsize)  # nblocks

    for i in 1:10
        @roc groupsize=groupsize gridsize=gridsize mycopy!(dst, src)
        AMDGPU.synchronize()
    end

    AMDGPU.unsafe_free!(dst)
    AMDGPU.unsafe_free!(src)
    AMDGPU.synchronize()
    return
end
main(2^24)
ENABLE_JITPROFILING=1 rocprofv2 --plugin perfetto --hip-trace --hsa-trace --kernel-trace -o prof julia ./profile.jlThis will produce prof_output.pftrace file which can be visualized using Perfetto UI.
| Zoomed out | Zoomed in |
|---|---|
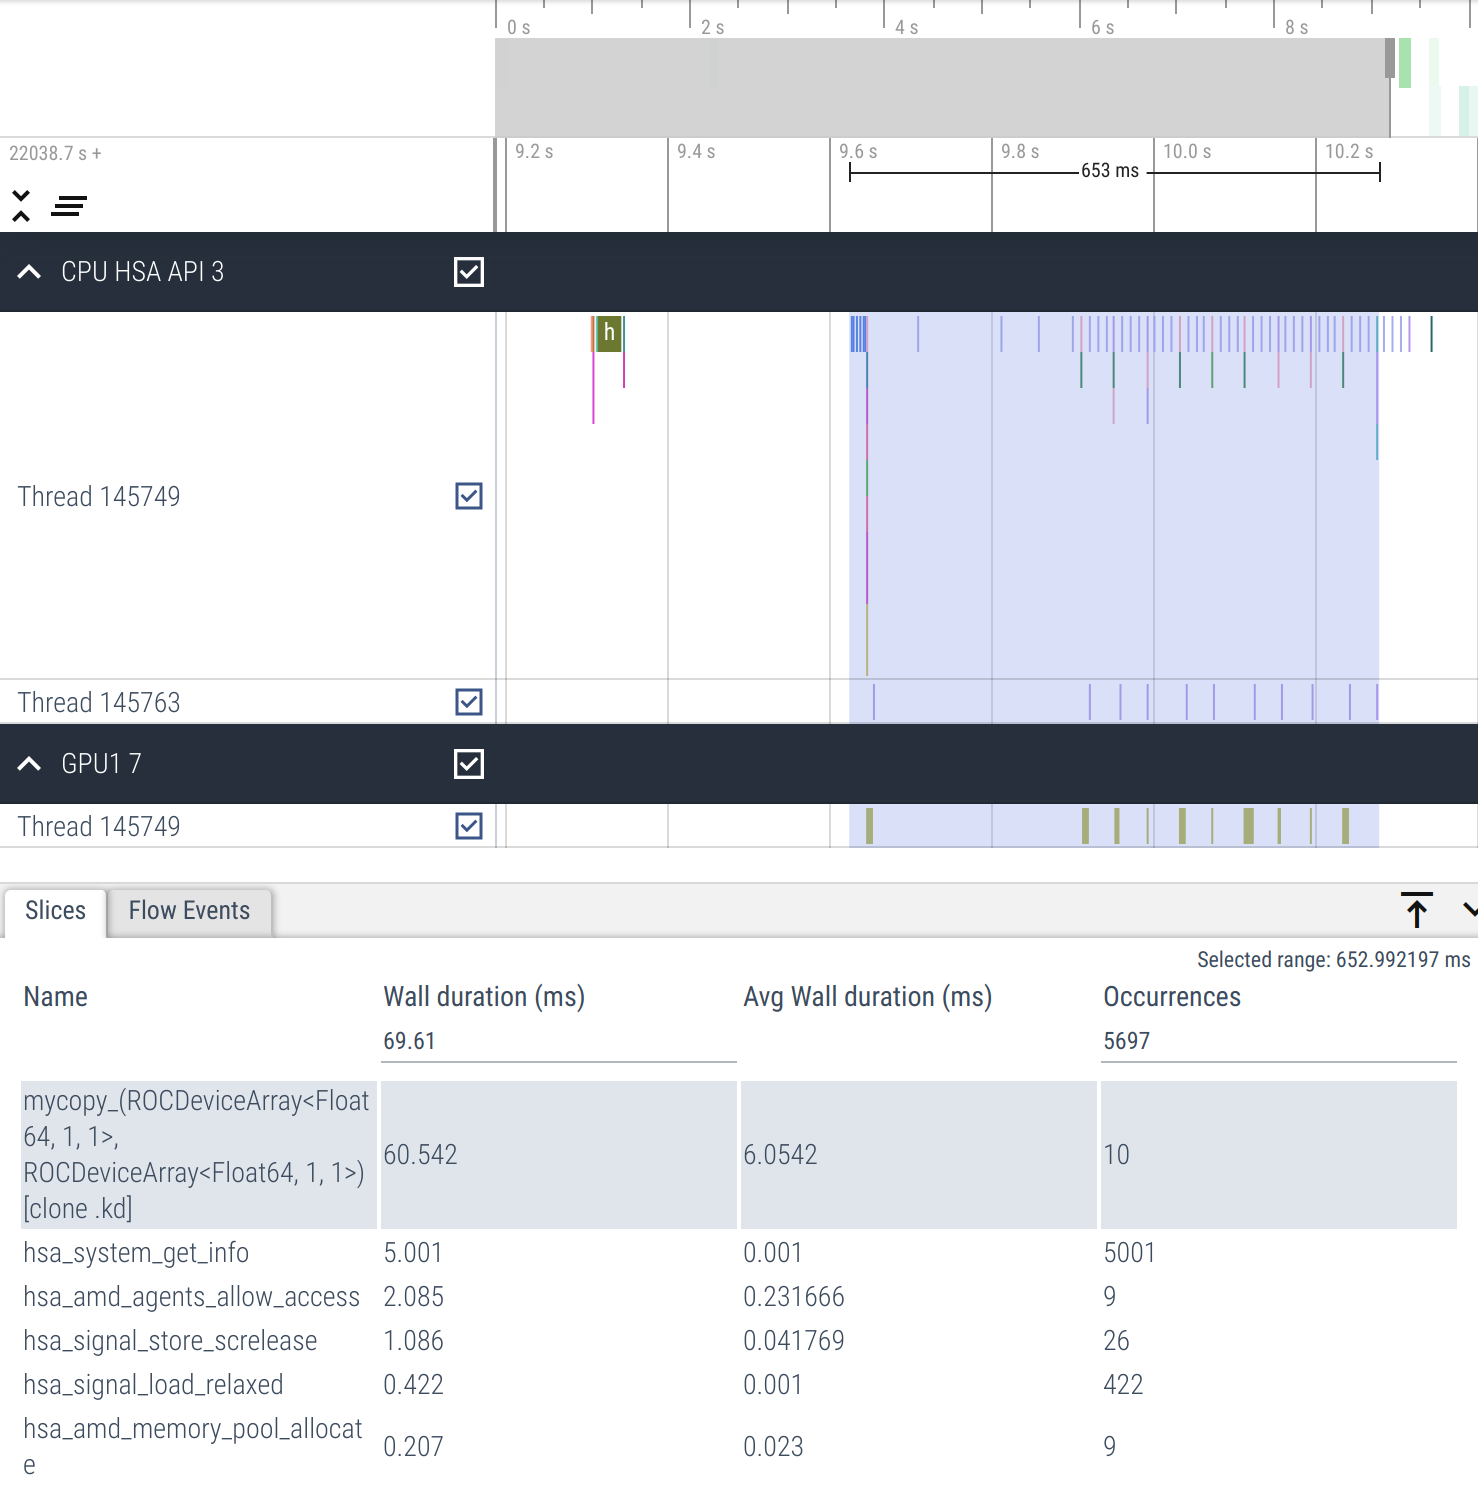 | 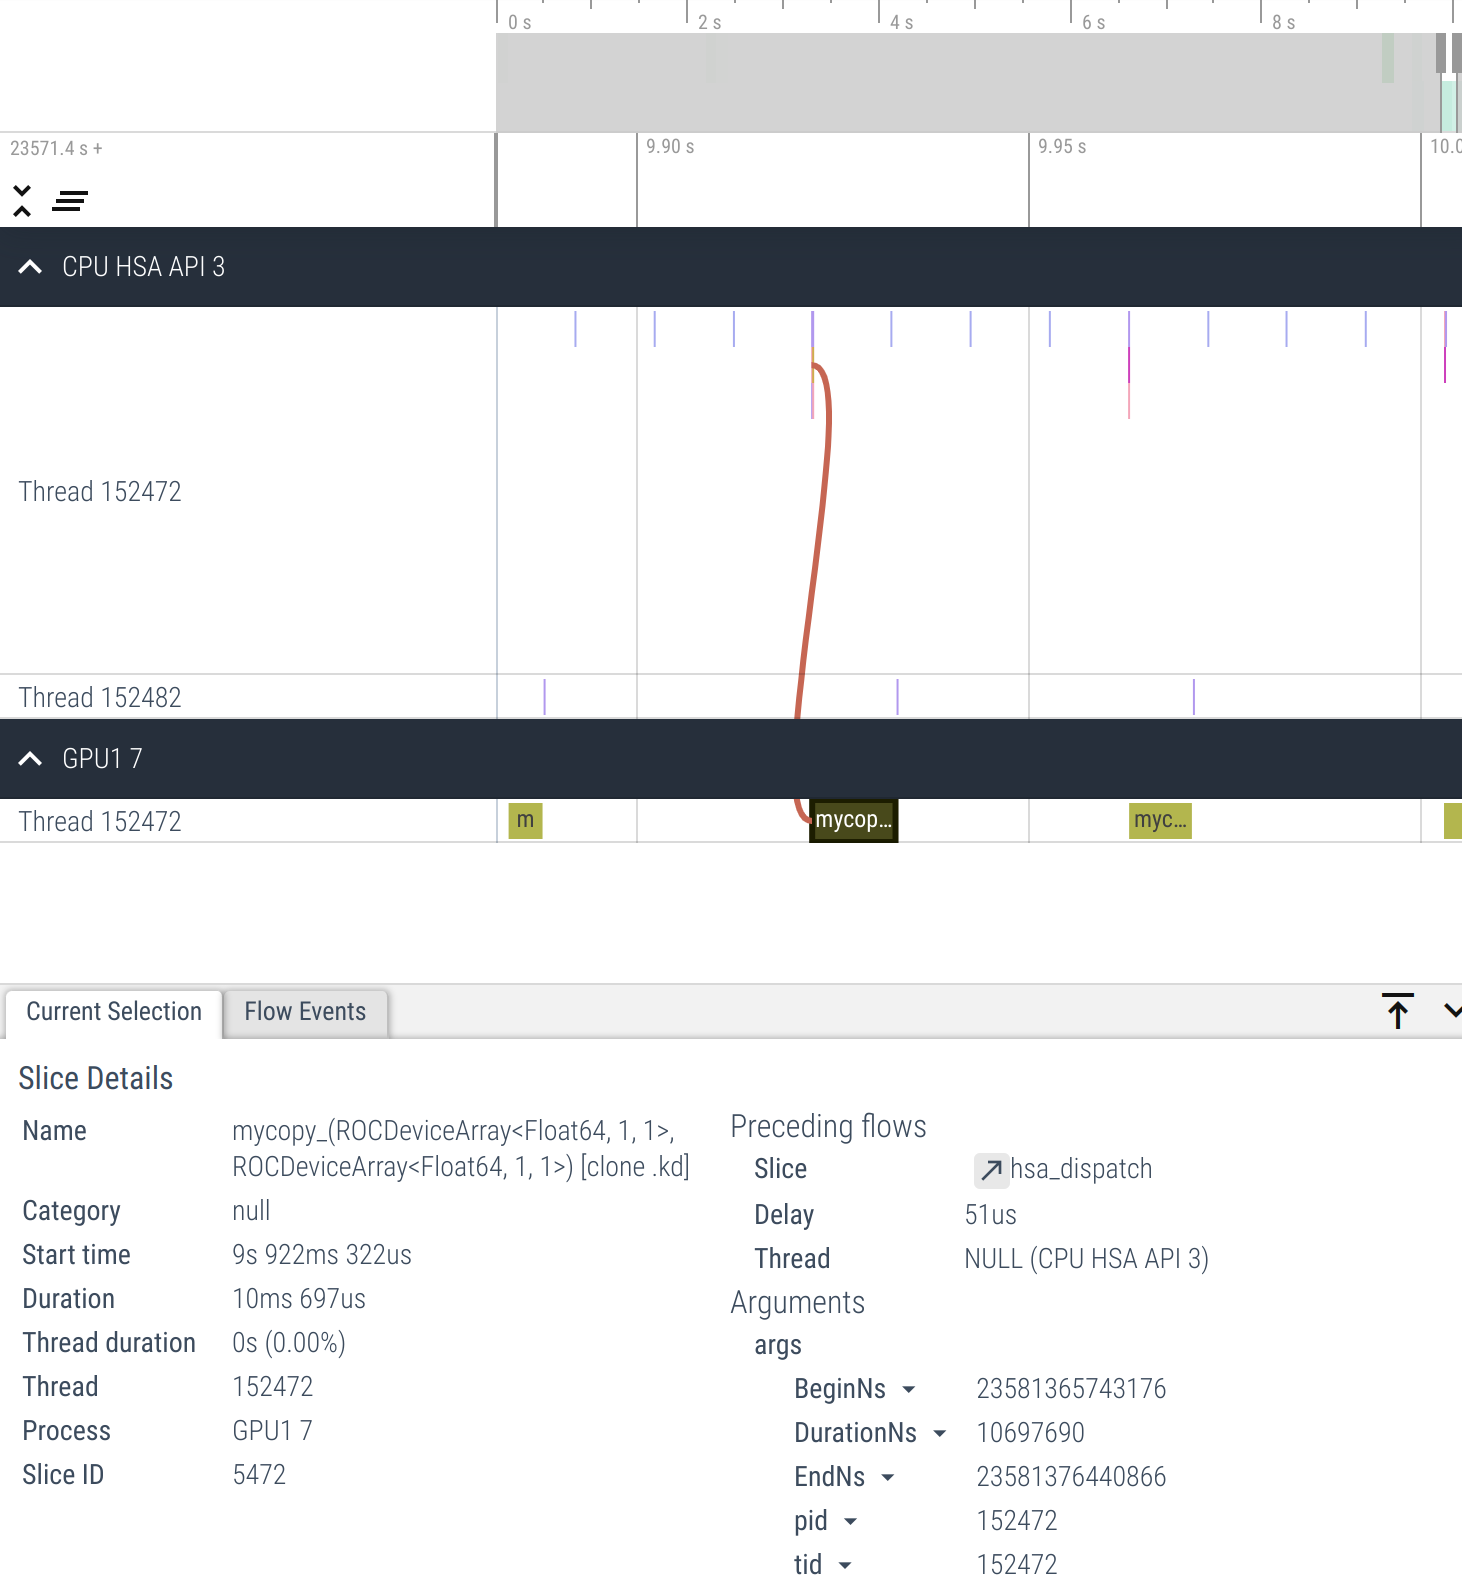 |
Here we can clearly see that host synchronization after each kernel dispatch causes poor device occupancy (empty spaces between kernel dispatches).
We can fix this by moving synchronization outside the loop so that it happens only once.
    ...
    for i in 1:10
        @roc groupsize=groupsize gridsize=gridsize mycopy!(dst, src)
    end
    AMDGPU.synchronize()
    ...
Running profiling again and visualizing results we now see that kernel launches are adjacent to each other and that the average wall duration is lower.
| Zoomed out | Zoomed in |
|---|---|
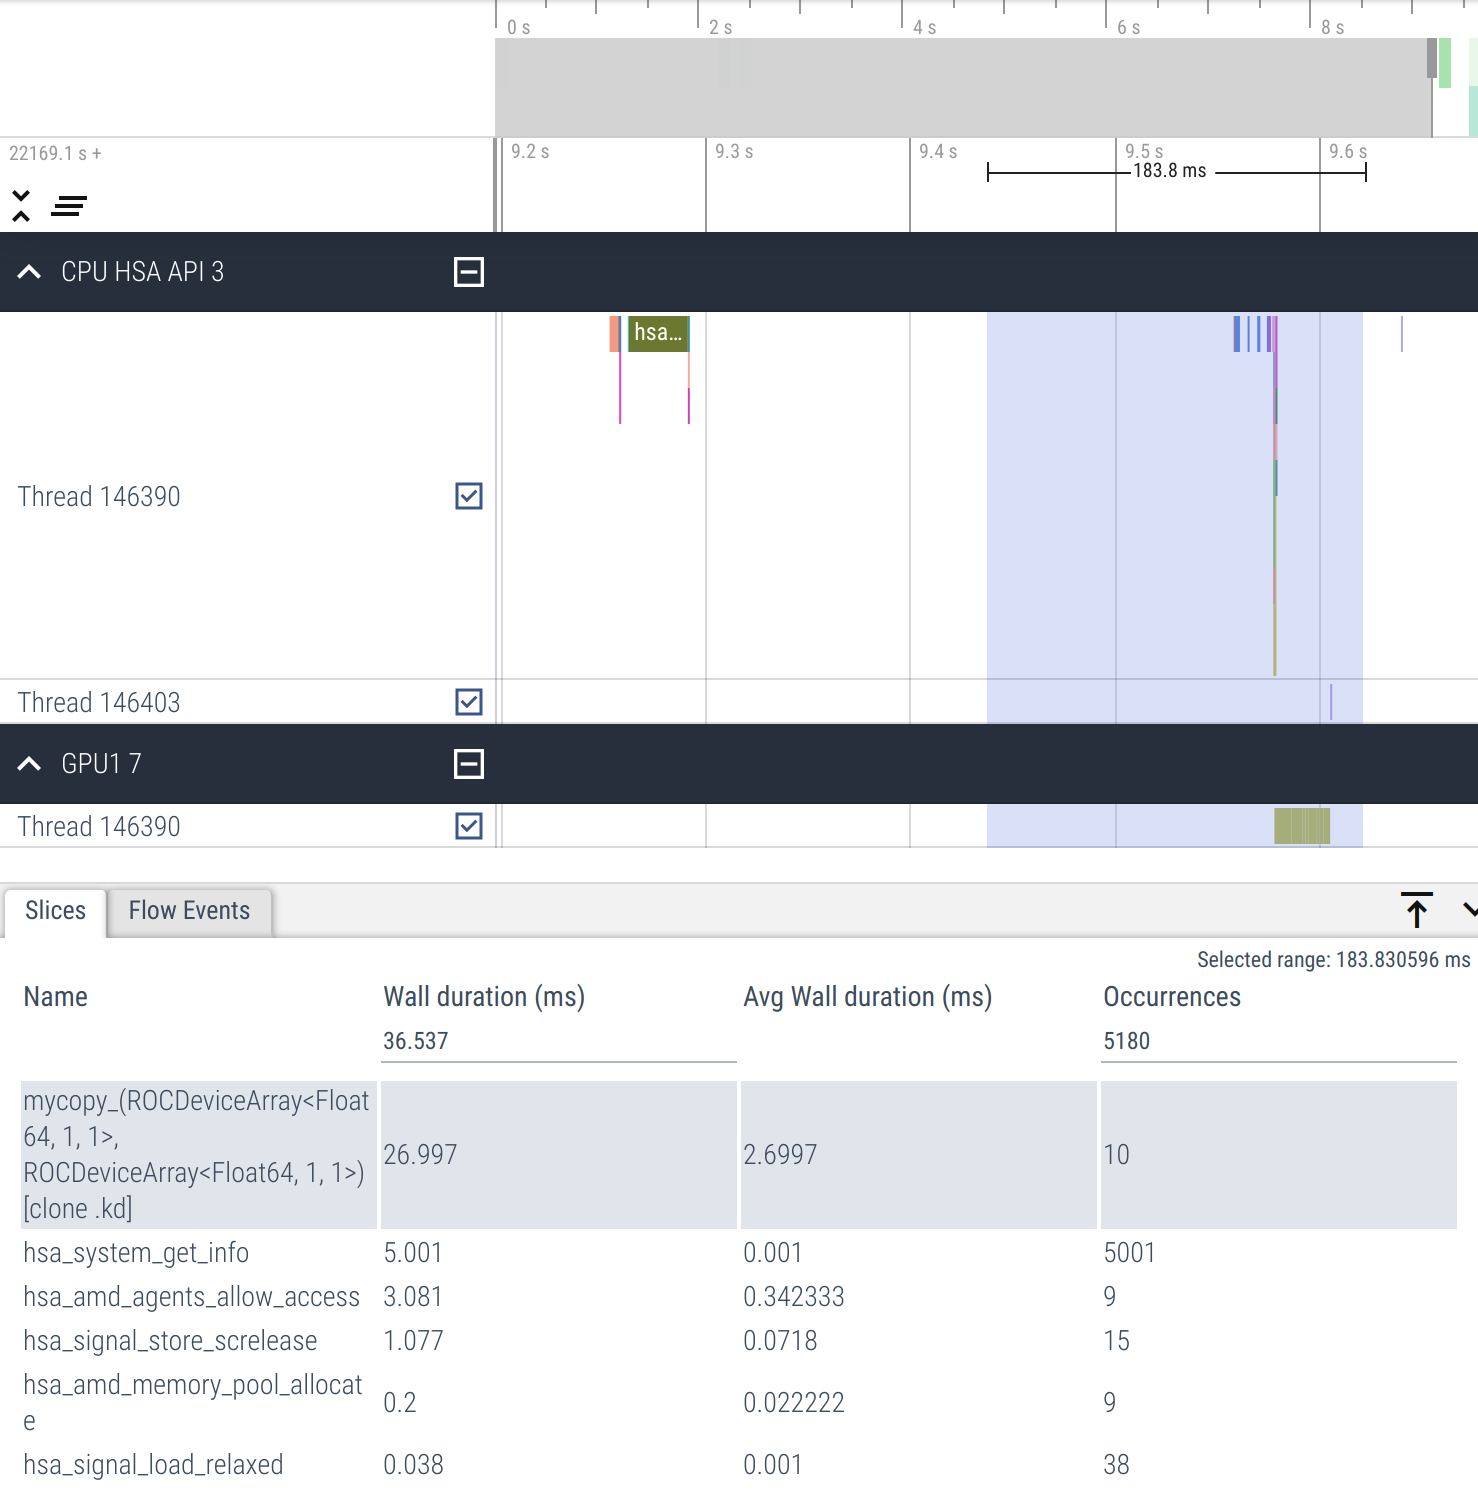 | 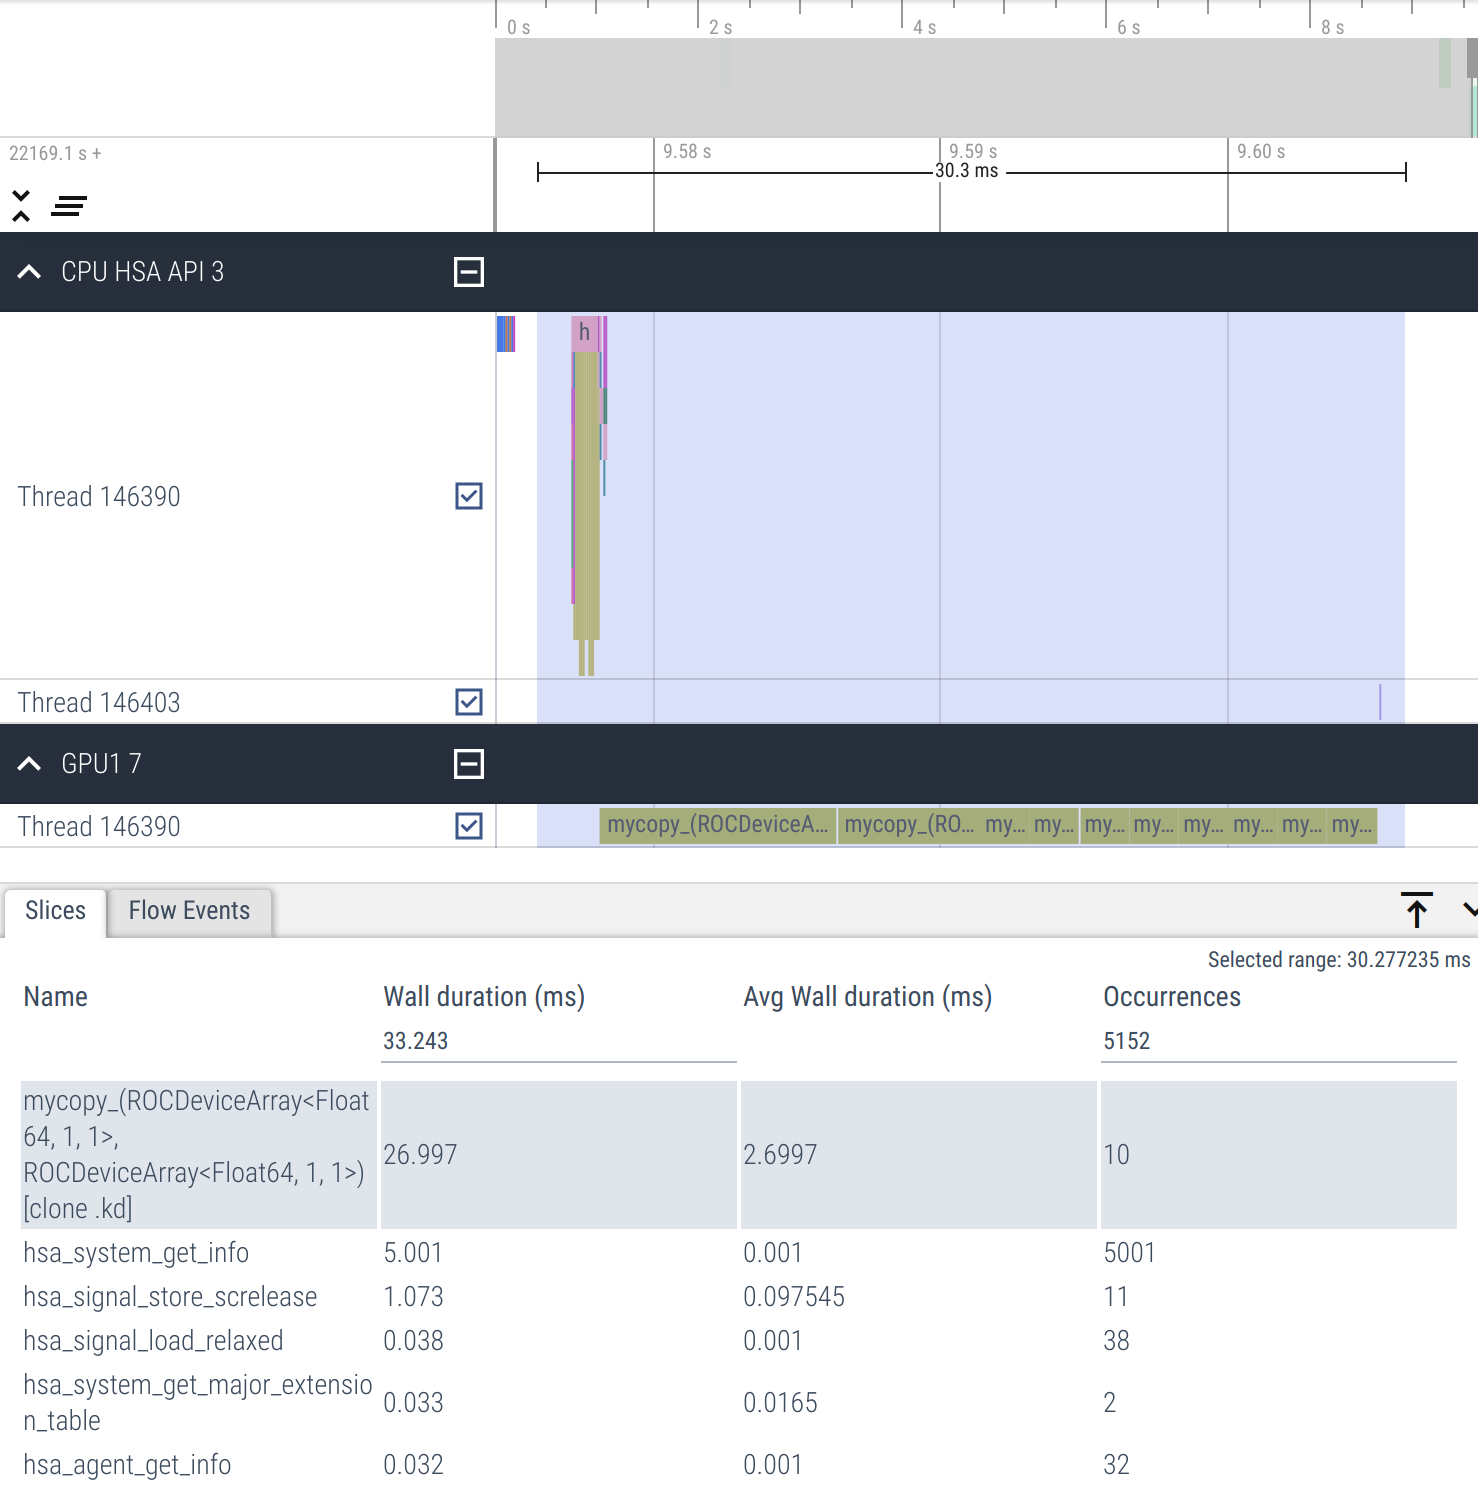 |